Security Events
About This Feature
The Security Events page shows a real-time stream of two kinds of security events: events detected by Tetragon (TracingPolicy violations, covering every hook kind a policy can attach to: kprobes, tracepoints, uprobes and LSM hooks) and Cilium Network Policy denials. Whether events are recorded in Monitoring mode or blocked in Protect mode, they all appear here in real time, and events are persisted across restarts.
Events are deduplicated by content over a 30-second window (the client-side port is ignored for the comparison), so a pod retrying a denied connection accumulates a count on the existing row instead of filling the list. Alerts and Syslog fire from this list: each fires once when an event is first recorded, and a repeat folded into an existing row notifies nobody.
Real-Time Streaming
The K8s Sentinel backend (v0.43+) collects runtime events from each node's Tetragon Agent over its gRPC GetEvents stream (which is why Tetragon must bind its gRPC to the pod network - see Installing Tetragon), then uses Server-Sent Events (SSE) to establish a persistent one-way connection from the server to the browser, continuously pushing new events to the frontend - no polling required, ensuring events appear with minimal latency.
Viewing Security Events
Navigate to the "Security Events" page. Events are listed in reverse chronological order with the most recent at the top.
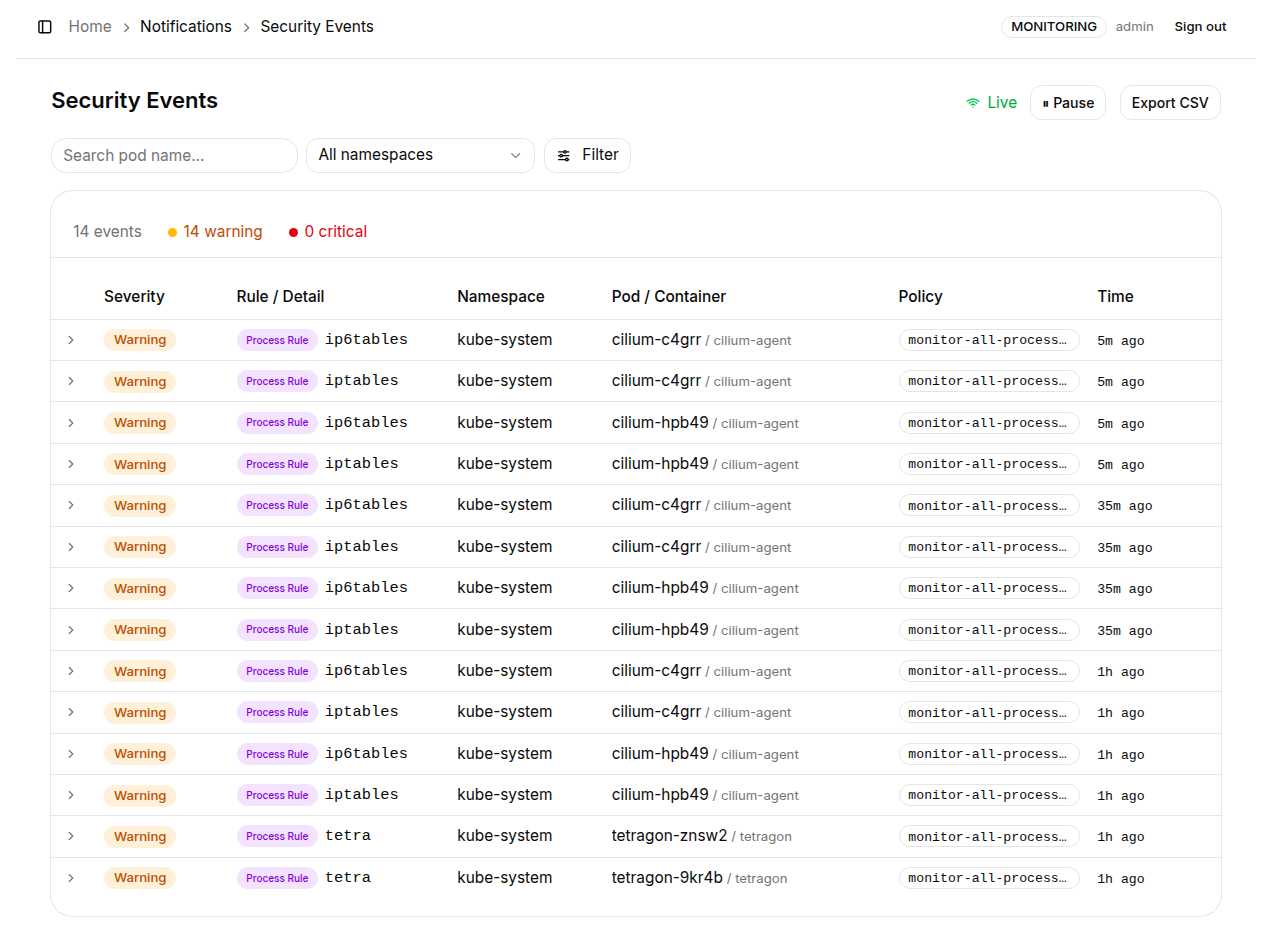
Toolbar elements:
| Element | Description |
|---|---|
| Live / Disconnected indicator | Live means the SSE connection is active and events are being received in real time; Disconnected means the stream dropped - wait a moment or reload the page to reconnect |
| ⏸ Pause | Click to pause the event stream; the page freezes the current list for easier review. Click again to resume |
| Export CSV | Export the currently displayed event list as a CSV file for offline analysis or archiving |
Event statistics row: Shows the total event count in the database, broken down by Warning and Critical.
A repeated event keeps its place in the list and takes its new count and time (v0.64.2+; in v0.64.0 and v0.64.1 it jumped to the top on every repeat, which kept the list reshuffling). Since v0.64.1, Tetragon appending to its own export log (/var/log/tetragon/) is no longer reported as a security event.
Filtering Events
Three filters at the top of the page can be applied simultaneously (AND logic):
| Filter | Description |
|---|---|
| Search pod name... | Enter a Pod name keyword to instantly filter matching events |
| All namespaces | Select a specific Namespace from the dropdown to show only events from that Namespace |
| Filter | Opens a filter panel with Severity checkboxes (Warning / Critical) and Rule type checkboxes (Process / File / Network / Kernel) |
Event Table Columns
| Column | Description |
|---|---|
| Severity | Severity level: Warning or Critical |
| Rule / Detail | The rule type that triggered the event (Process Rule / File Rule / Network Rule) and a summary - e.g., the binary name executed or the connection destination IP |
| Namespace | The Namespace of the Pod that triggered the event |
| Pod / Container | The Pod name and Container name that triggered the event |
| Policy | The TracingPolicy name that matched this event |
| Time | When the event occurred (relative time, e.g., "just now", "5m ago") |
Click any event row to expand an inline detail panel:
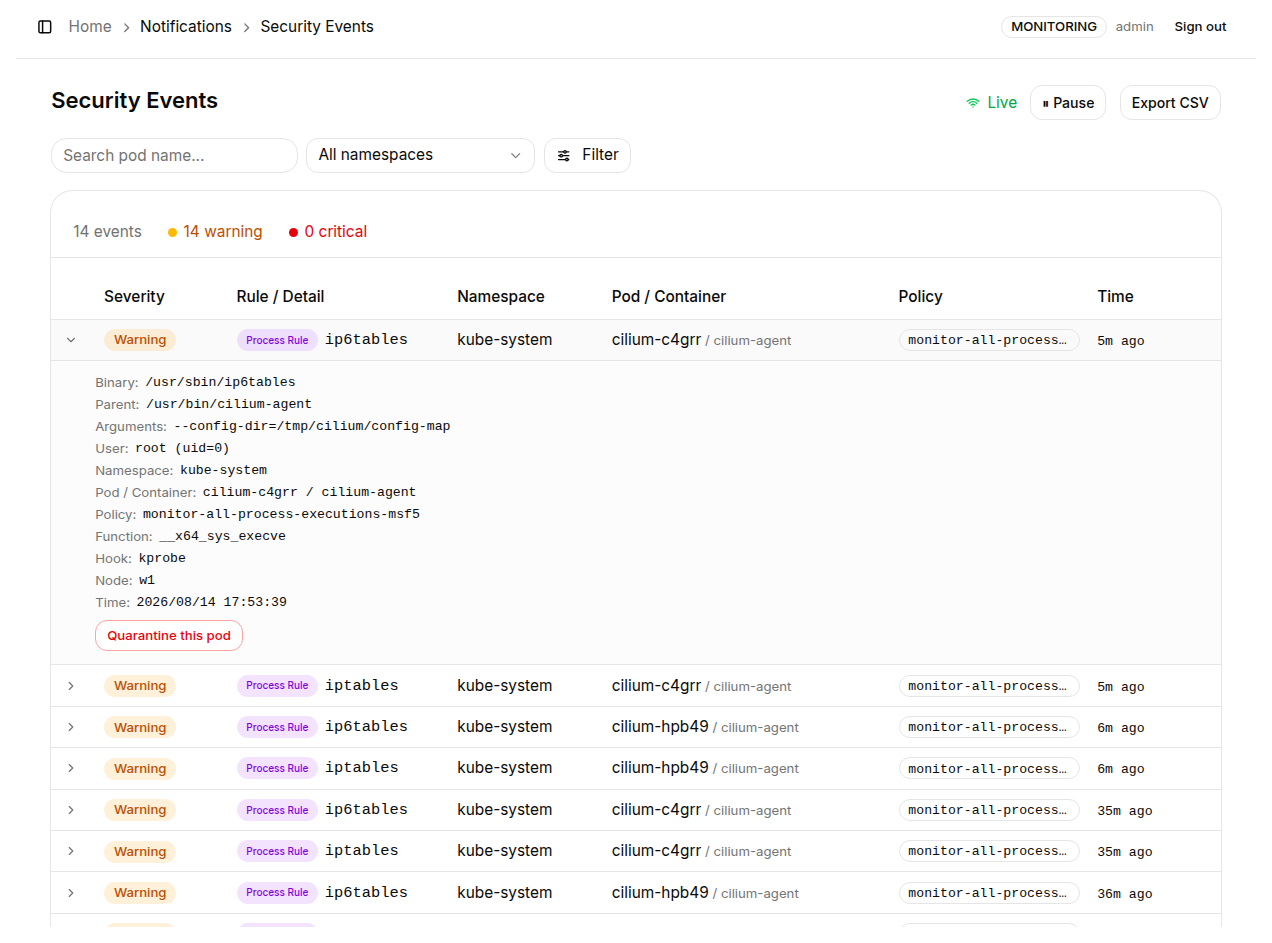
The panel shows the raw event data: Binary (full executable path and arguments), Parent (full parent process command line), User (user and uid), Namespace, Pod / Container, Policy, Function (the kernel function that fired, e.g. __x64_sys_execve), Hook (hook type, e.g. kprobe), Node, and Time.
Events from LSM hooks also show what the call actually touched - e.g. file_open shows File (open): /etc/shadow, and socket_connect shows Destination: 10.0.0.5:443.
The bottom-right of the panel has a "Quarantine this pod" button to network-isolate the Pod that triggered the event - see Pod Quarantine.
Event Severity Levels
| Level | Description |
|---|---|
| Warning | Violations recorded in Monitoring mode - e.g., executing an unexpected program, accessing an unexpected file path, or initiating an unusual network connection. Requires further review |
| Critical | Behavior actively blocked in Protect mode (the process was terminated by Tetragon's Signal / NotifyEnforcer actions) - reported as Critical on every hook kind. Requires immediate review |
The number of retained events and retention period can be configured under Settings → Event Retention. The default is up to 500 Warning events, 300 Critical events, and a TTL of 7 days.