Network Topology
Overview
Network Topology visualizes the actual network connections between Pods in the cluster as an interactive graph. The data comes from network traffic observed by Cilium, including L7 application-layer information (the page badge shows "Cilium · L7"). Operators can grasp real traffic flows at a glance - no raw event logs to decipher - making it easy to spot anomalous connections and to design Network Policies from observed behavior.
Viewing the Topology Graph
Open the "Network Topology" page and the observed connections render automatically as a node graph. The graph shows live traffic within a 15-minute window: a connection that stops falls off, and one that resumes reappears. With Auto refresh on, it updates silently every 60 seconds (no flicker, no camera reset).
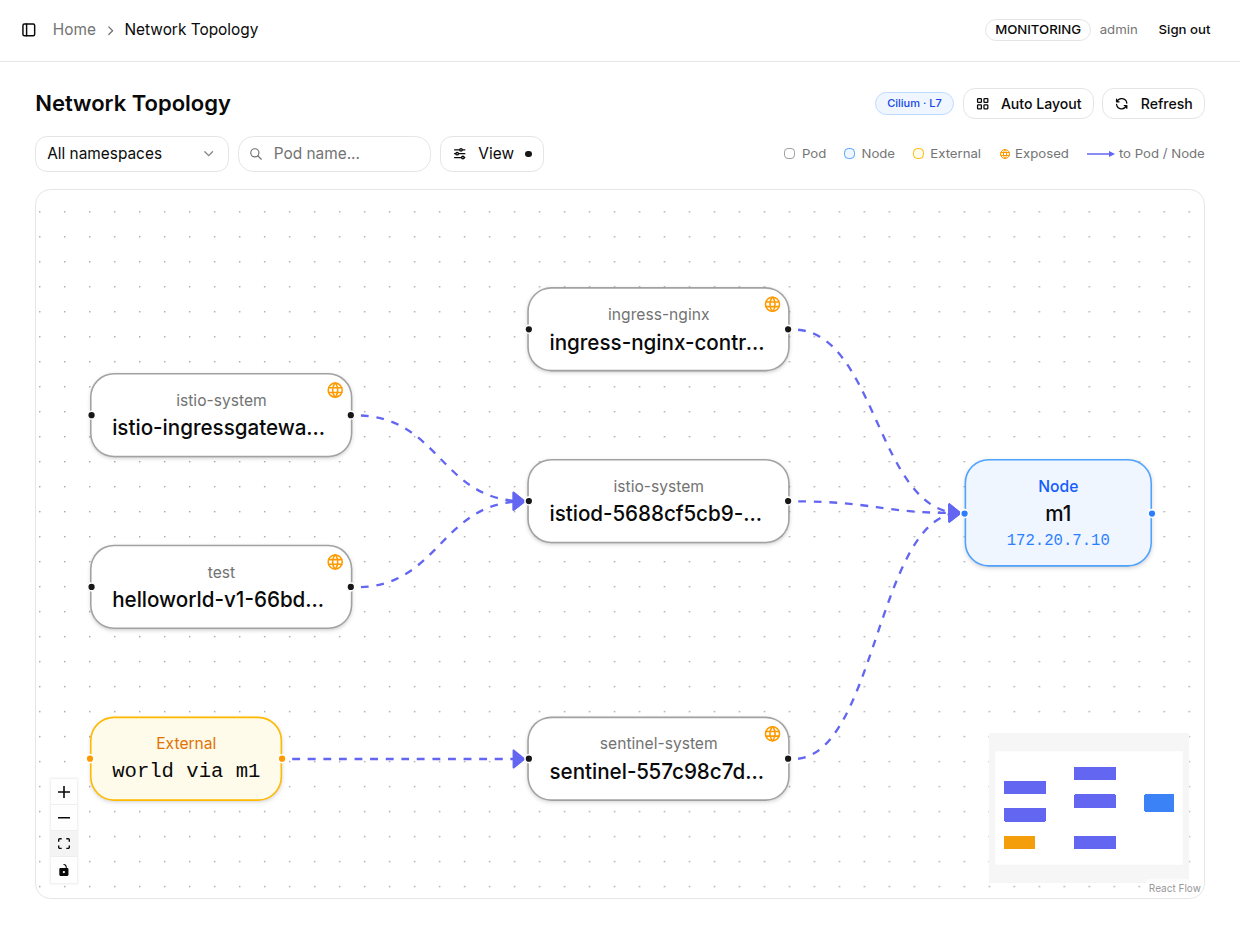
Nodes and legend (the legend lists only the kinds actually on the canvas):
| Item | Description |
|---|---|
| Pod node | A Pod in the cluster, showing its namespace and Pod name; a quarantined Pod carries a red border and a lock icon; a Pod whose own images have Critical vulnerabilities carries a red bug icon in its top-left corner (v0.61+) |
| Node node | A Kubernetes node (blue), showing its name and IP address |
| Link-local node | Link-local addresses such as 169.254.0.0/16 (slate), e.g. a sidecar probing cloud metadata (169.254.169.254), kept distinct from external traffic |
| External node | A connection source or destination outside the cluster (amber); external traffic SNATed through a node is labelled "world via node" |
| Red dashed edge | A connection denied by a Network Policy; click it to see which policy blocked it (a default-deny drop with no rule to attribute says so rather than inventing one) |
| Exposed edge | An edge marked Exposed represents a path where a Pod / Node is directly reachable from outside. Detection sources cover Services (NodePort / LoadBalancer / externalIPs), Kubernetes Ingress, Gateway API (HTTPRoute / GRPCRoute, plus TCPRoute / TLSRoute / UDPRoute since v0.41), Istio VirtualService / Gateway, Traefik IngressRoute variants, Contour HTTPProxy and hostNetwork / hostPort; CRDs that are not installed are skipped silently |
| ×N label | Connections are aggregated per source/destination pair; the number is the connection count, with the per-port breakdown in the detail panel |
Connection Detail
Click any edge to open the Connection Detail panel:
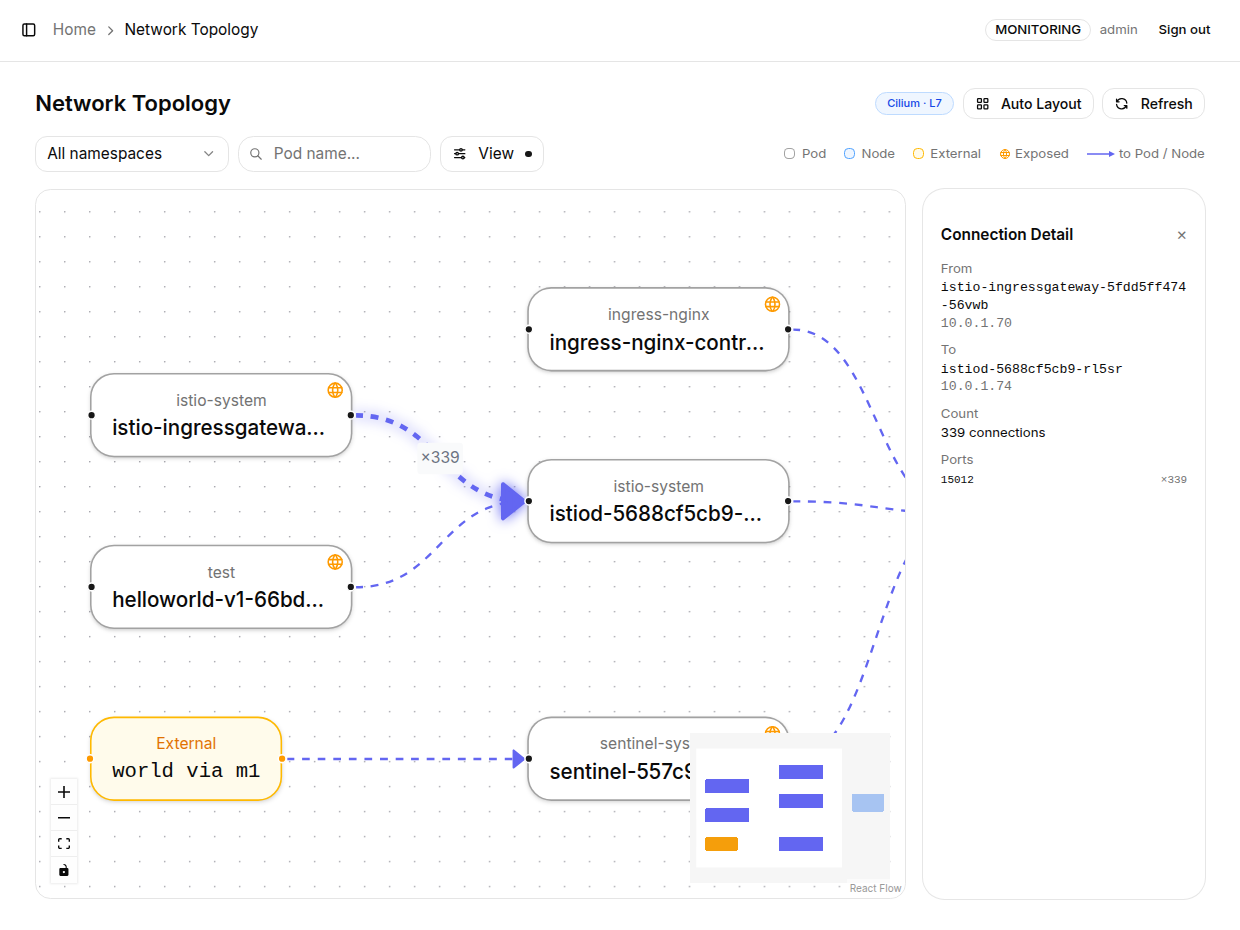
| Field | Description |
|---|---|
| Source / Destination | Pod names and IP addresses of both ends |
| Connections | Cumulative connection count |
| Ports | Destination ports used, with a count per port |
Vulnerability Marks
Since v0.61, if Trivy Operator is installed, a red bug icon appears in the top-left corner of a node when the Pod's own images have Critical vulnerabilities, alongside the network state mark in the other corner. Click the Pod and the detail panel shows the number of Critical vulnerabilities, and notes it specifically when the Pod is also reachable from outside the cluster.
The mark follows the image each Pod is itself running: a Pod still running an old, unscanned image is not marked on the strength of the scan results of the new image. For the full list of vulnerabilities, see Workload Vulnerabilities.
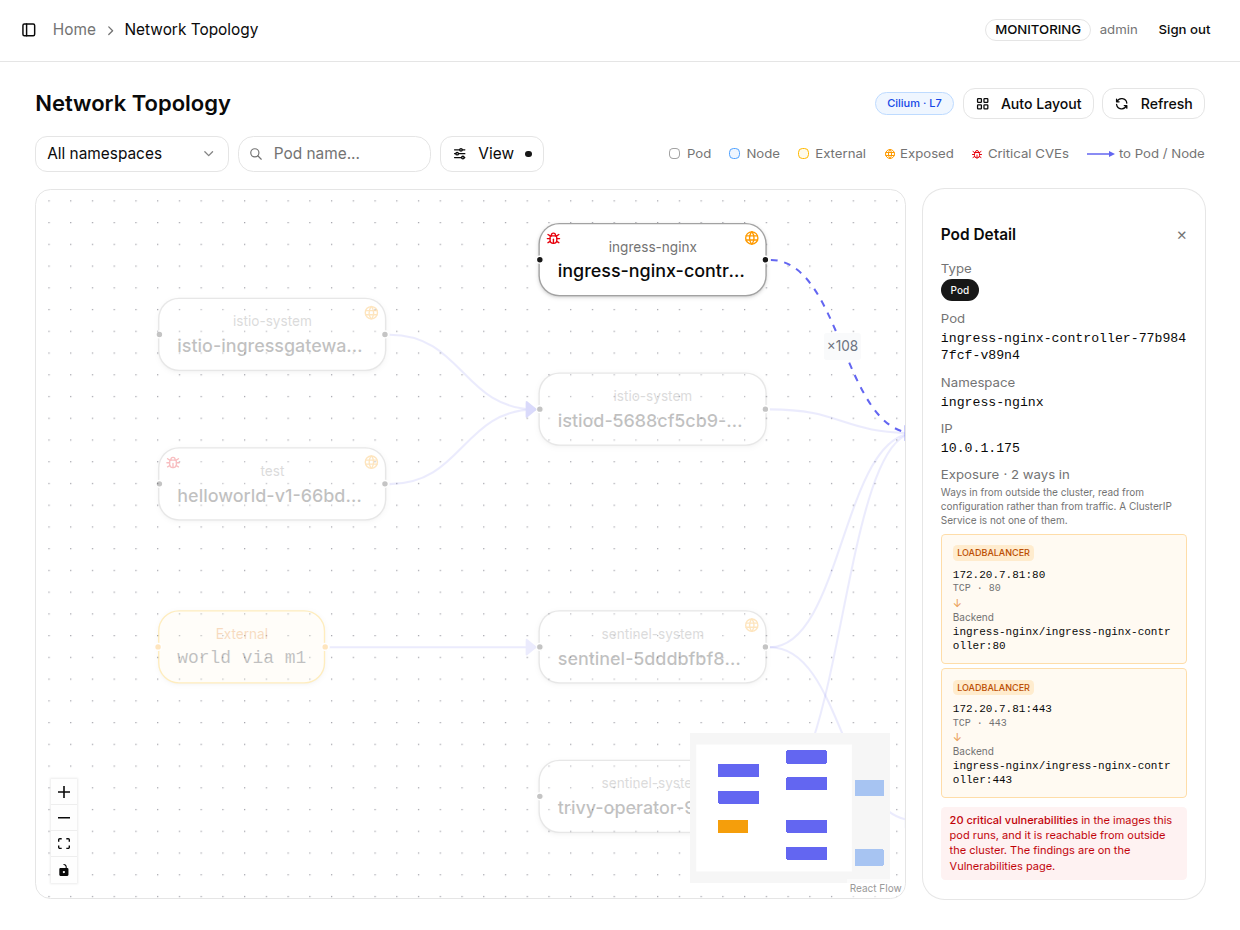
When such a Pod is on screen, the legend gains a "Critical CVEs" entry.
Filters and View Options
The toolbar at the top offers:
| Element | Description |
|---|---|
| All namespaces | Show only connections involving a specific namespace |
| Pod name... | Search box to quickly locate a node by name |
| View menu | View options: Hide kube-system (on by default), Hide health probes (on by default), Exposed only (show only externally exposed connections), Auto refresh (on by default) |
| Auto Layout | Re-run the automatic layout of all nodes |
| Refresh | Re-query the latest connection data immediately |
Graph Interactions
| Action | Description |
|---|---|
| Drag a node | Freely reposition nodes to adjust the layout |
| Mouse wheel | Zoom the whole graph in and out |
| Zoom In / Out | Precise zoom via the +/- buttons |
| Fit View | Scale the graph to fit the window |
| Toggle Interactivity | Lock/unlock graph interaction |
| Mini Map | Thumbnail in the corner showing your position in the overall topology |
How It Works
Cilium, as the cluster CNI, observes all Pod traffic in the data plane, including L7 protocol information; every node's flows are aggregated behind one gRPC endpoint by Hubble Relay. The K8s Sentinel backend (v0.43+) reads the cluster-wide traffic from Relay's GetFlows stream, aggregates it by Pod, node and external endpoint, and serves the latest connection graph to the frontend. With Auto refresh enabled, the topology updates automatically as new traffic is observed.
This feature therefore requires Cilium with both hubble.enabled=true (flow observation) and hubble.relay.enabled=true (the hubble-relay service K8s Sentinel reads) - see Installing and Configuring Cilium.
Let your workloads run under normal traffic for a while to accumulate observations, then base your Network Policy whitelist rules on the connections actually shown in the graph (source, destination and ports). This avoids missing a required connection and breaking a service.