Event Sources
Overview
The Event Sources page (since v0.49, an expansion and rename of the former "Tetragon Agents" page) answers the most important question for a security console: is K8s Sentinel actually receiving events right now? It shows the live state of both event sources: the Tetragon agent on every node, and Hubble Relay. Since v0.61 it also lists the status of the vulnerability scanner, Trivy Operator.
A Pod's Kubernetes readiness only says the agent is up - not that the event stream is connected. A blocking NetworkPolicy, a wrong gRPC address, or a TLS mismatch all leave the agent looking healthy while not a single event arrives. This page shows the real state of the streams, avoiding the worst failure mode: looking like it is monitoring while it is blind.
Viewing Event Sources
Open "Cluster → Event Sources":
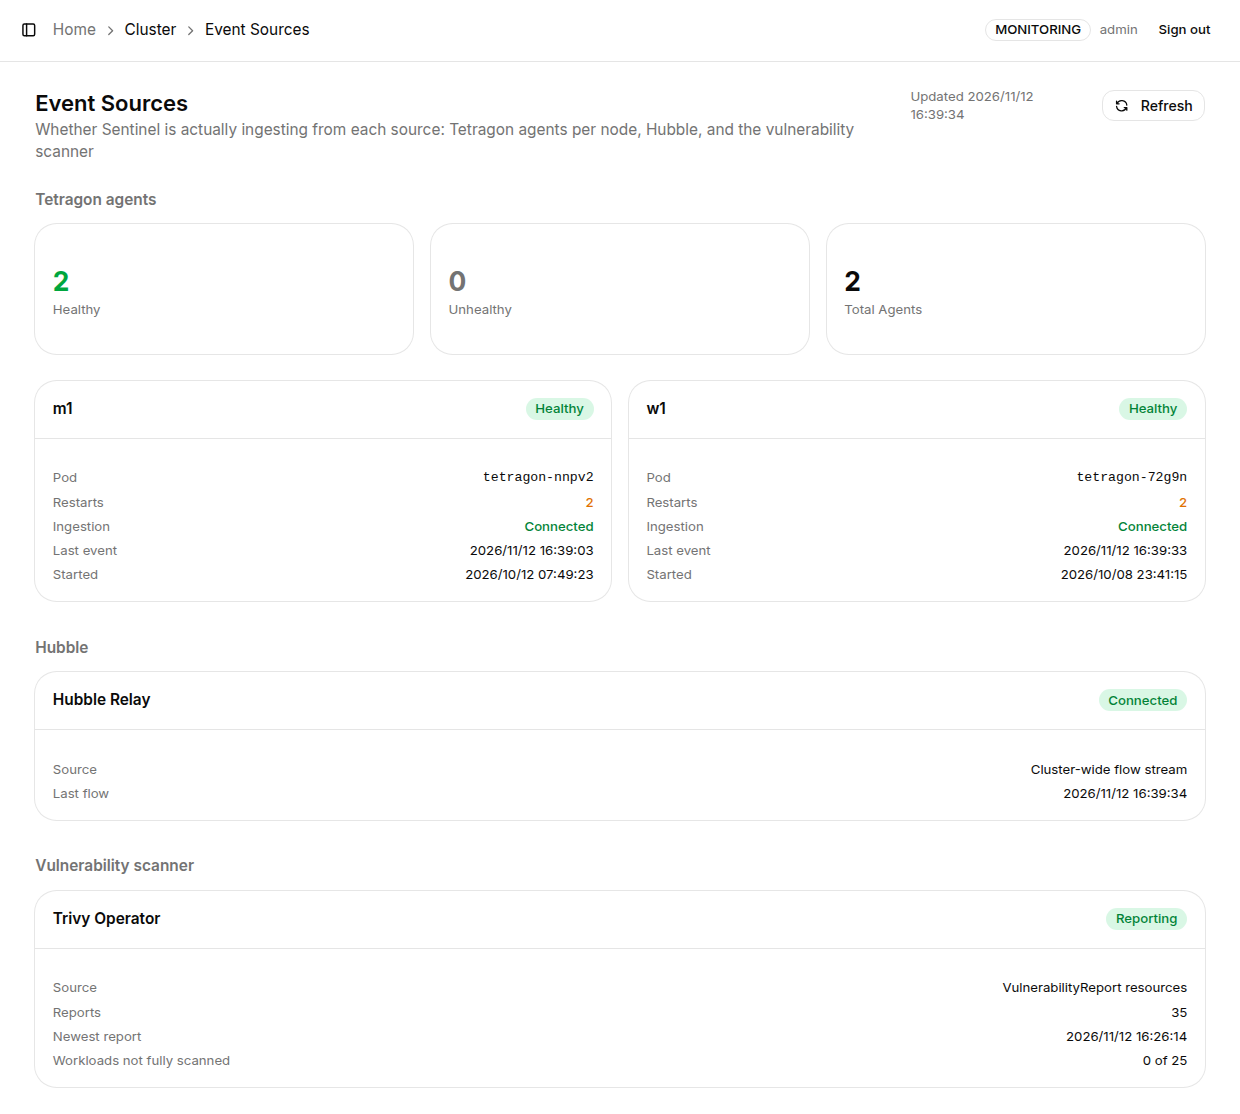
Tetragon agents section
Summary cards: Healthy / Unhealthy / Total Agents (Tetragon is a DaemonSet, so the total usually equals the node count).
Per-node card fields:
| Field | Description |
|---|---|
| Node name | The node the agent runs on, with a health badge (Healthy / Unhealthy / Stream Down) |
| Pod | The Tetragon Pod on that node |
| Restarts | Pod restart count; shown in orange when non-zero |
| Ingestion | The event stream state: Connected means K8s Sentinel's gRPC stream to this agent is live; Stream Down (red) means the Pod is Ready but the stream is broken, with the consecutive-failure count and the last error |
| Last event | When an event last actually arrived (informational only: health is connection liveness, not event volume, so a calm cluster is never mistaken for a broken one) |
| Started | The Pod's last start time |
Hubble section
A standing Hubble Relay status card: connection state, last flow time, consecutive failures, and last error. This is the data source for Network Topology.
On a cluster without Cilium, this section reads as a muted "Not detected": that is a configuration fact, not a broken stream, so it is not shown as a red alarm.
Vulnerability scanner section
Since v0.61, the Vulnerability scanner section at the bottom of the page shows the status of the vulnerability scanner in a Trivy Operator card (the data source is the VulnerabilityReport resources):
| Status | Description |
|---|---|
| Reporting | Trivy Operator is producing reports normally |
| Not detected | Trivy Operator was not found in the cluster (not being installed is a configuration fact, not a fault) |
| No reports yet | Installed, but no report has been written yet |
| Not permitted | K8s Sentinel's ClusterRole lacks the rule to read reports; re-apply deploy/sentinel.yaml |
| Error | An error occurred while reading the reports |
| Stale | No new report has been written for 7 days; with the operator's default daily rescan, this means it has stopped working |
The card also shows Reports (the number of reports), Newest report (the time of the newest report) and Workloads not fully scanned (the number of workloads not fully scanned). For installation and troubleshooting, see Installing Trivy Operator.
Behavior When a Stream Fails
- A red banner appears on the Dashboard the moment any stream has failed, and the Tetragon stat card reflects streams rather than plain Pod readiness
- Since v0.64, one unreachable Tetragon agent no longer interrupts event collection from the other nodes, and nodes that join later are connected to automatically; scaled-down nodes are pruned automatically
- A recovered source clears its failure streak
- Programmatic access:
GET /api/ingestion/healthreturns every source's status
When a node shows Stream Down or Unhealthy, security events from every Pod on that node are not being detected, and TracingPolicy Protect mode is ineffective there: a real protection gap. Check first: the Tetragon gRPC address (0.0.0.0:54321, see Installing Tetragon), NetworkPolicies blocking K8s Sentinel's connection to the node, and TLS settings.