Dashboard Overview
About This Page
The Dashboard is the home page after logging in to K8s Sentinel. It provides a real-time overview of cluster security monitoring status, including Tetragon Agent health, security event counts, and global protection mode - letting you assess the security posture of your entire cluster at a glance. It also previews the latest Tracing Policies, Admission Policies, Network Policies, the current Quarantine state, and a vulnerability scan summary.
Statistics Cards
After logging in, the top of the Dashboard displays four statistics cards providing a real-time snapshot of cluster status.
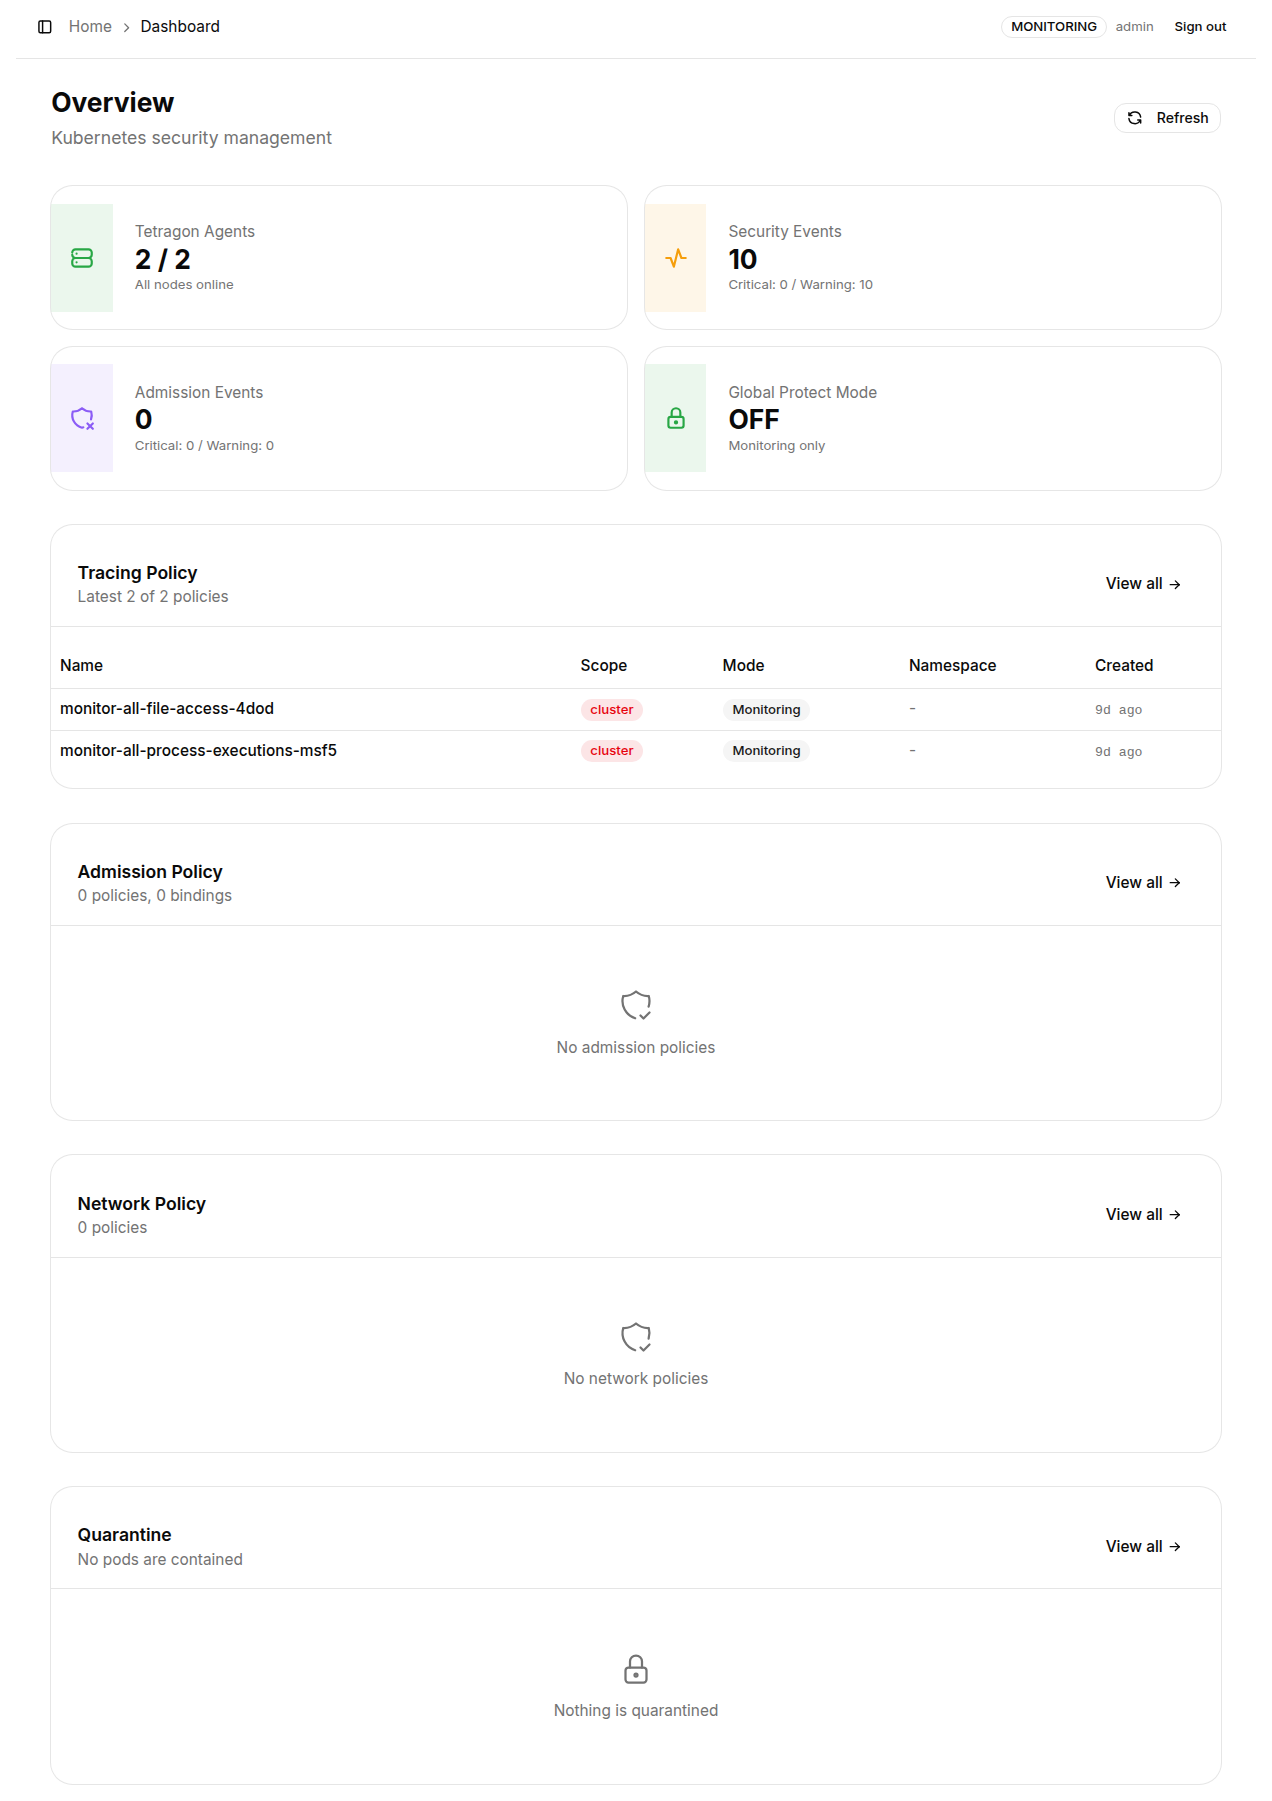
| Card | Description |
|---|---|
| Tetragon Agents | Health ratio of Tetragon Agents in the cluster (e.g. 2 / 2); since v0.49 this reflects event stream state rather than plain Pod readiness - a red banner appears the moment any stream fails |
| Security Events | Total number of security events (kprobe violations) recorded so far; includes both Warning and Critical events |
| Admission Events | Total number of Kubernetes admission control violations recorded by ValidatingAdmissionPolicy (VAP) |
| Global Protect Mode | Global protection mode toggle state (On / Off); when enabled, all TracingPolicies simultaneously switch to Protect mode |
Vulnerabilities Card
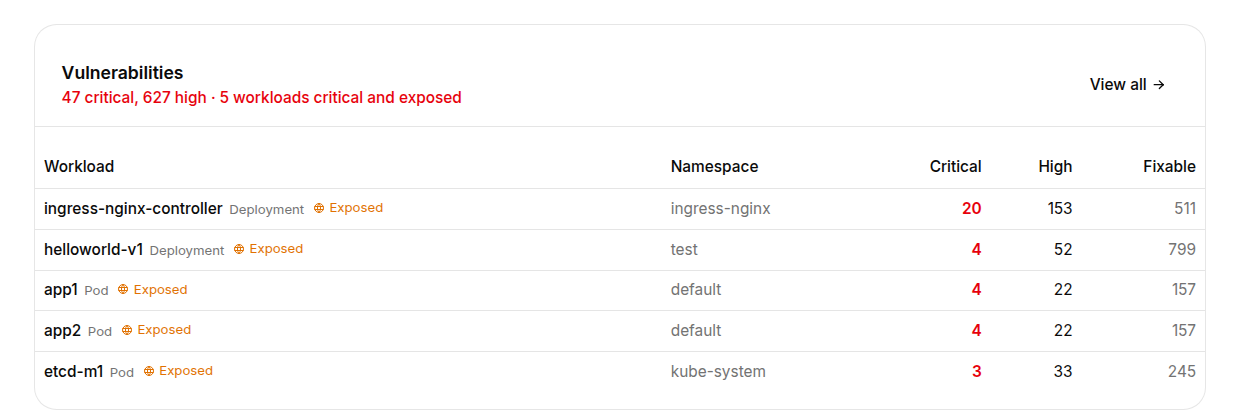
Since v0.61, the Dashboard shows a Vulnerabilities card, with data from Trivy Operator's scan reports (see Workload Vulnerabilities):
- Critical and High vulnerability totals
- The number of workloads that have a Critical finding and are also externally exposed (shown in red when greater than 0)
- The number of workloads that are not fully scanned
- The 5 workloads to fix first, with the columns
Workload,Namespace,Critical,HighandFixable; exposed ones carry anExposedbadge
This card is always shown: when there is no scanner it states "Scanning is not enabled" instead of presenting an empty table that could be mistaken for "the cluster is clean". Click the button in the card's top-right corner to jump to the Vulnerabilities page.
Tracing Policy Overview
The Dashboard shows the most recently created TracingPolicies (up to 4), including Name, Scope, Mode, Namespace, and creation time. Click "View all →" in the top-right corner to navigate to the full TracingPolicy list.
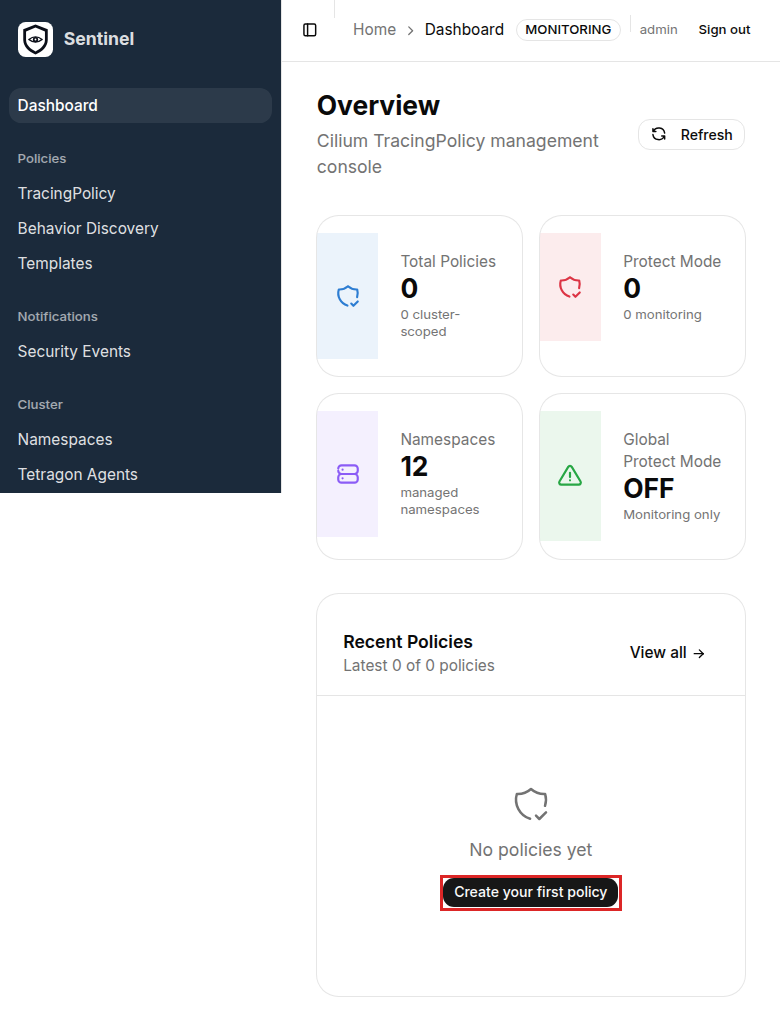
If no TracingPolicies have been created yet, this section displays a "Create your first policy" guide button.
Admission Policy Overview
The Dashboard shows an Admission Policy summary (Policy count and Binding count). If none exist, it shows a "No admission policies" prompt. Click "View all →" to navigate to the Admission Policy page.
Network Policy Overview
Shows a summary of the Cilium Network Policies in the cluster. If none exist, it shows a "No network policies" prompt. Click "View all →" to navigate to the Network Policy page.
Quarantine Status
Shows the Pods currently under quarantine. When nothing is quarantined, it shows "Nothing is quarantined". Click "View all →" to navigate to the Quarantine page.
How Data Updates
Dashboard statistics are retrieved by the backend querying the Kubernetes API Server and the internal event database. To get the latest data, click the "Refresh" button in the top-right corner of the page to trigger an immediate live query, ensuring all cards reflect the current cluster state.