Behavior Discovery
About This Feature
Behavior Discovery is K8s Sentinel's automated learning feature. Without creating any TracingPolicy in advance, it automatically collects and analyzes the actual execution behavior (process calls) of each Pod in the cluster - letting you build precise security policies based on real workload behavior rather than manually guessing which programs should be allowed.
How It Works
After Tetragon is installed, its base sensor starts by default and records process events for all Pods in the cluster, including each process's execution path, parent process, and associated Namespace and Pod information. K8s Sentinel continuously collects these raw events, groups and aggregates them by workload (Deployment / DaemonSet / Pod), and presents a readable behavior summary for review.
This feature requires no pre-existing TracingPolicy - it continuously accumulates observation data in the background.
Viewing the Behavior Discovery Page
Navigate to the "Behavior Discovery" page. Observation results are displayed as a card grid, with each card representing a workload.
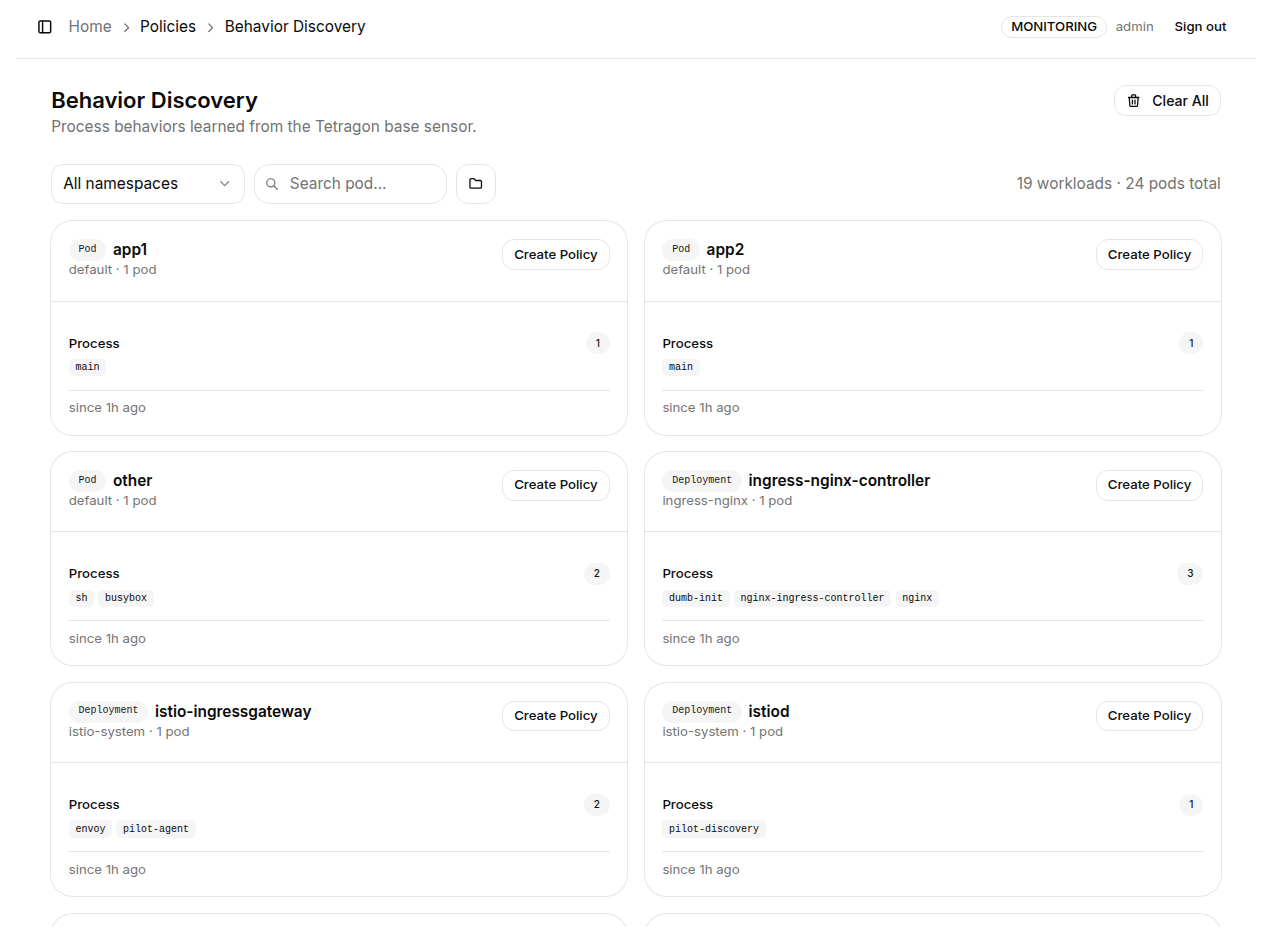
Page elements:
| Element | Description |
|---|---|
| Stats counter | Shows "N workloads · N pods total" in the top-right corner - the current count of observed workloads and Pods |
| Namespace filter | Select a specific Namespace to narrow the display |
| Search pod... | Enter a Pod name keyword to quickly locate workload cards containing that Pod |
| Group by namespace | Toggle to group cards by Namespace |
| Clear All | Clear all accumulated Behavior Discovery data and start learning fresh |
Workload card details:
Each card contains:
- Resource type badge:
Deployment,DaemonSet, orPod - Workload name: The name of the Deployment / DaemonSet / Pod
- Namespace · Pod count: The owning Namespace and number of managed Pods
- Process list: Unique executable paths detected during the observation period (showing binary names; hover to see full paths) along with execution counts
- since X ago: How long ago this card's observation data started accumulating
Create a Policy from Discovery Results
After confirming that the workload behavior summary matches expectations, you can generate a TracingPolicy directly from the Behavior Discovery page with one click.
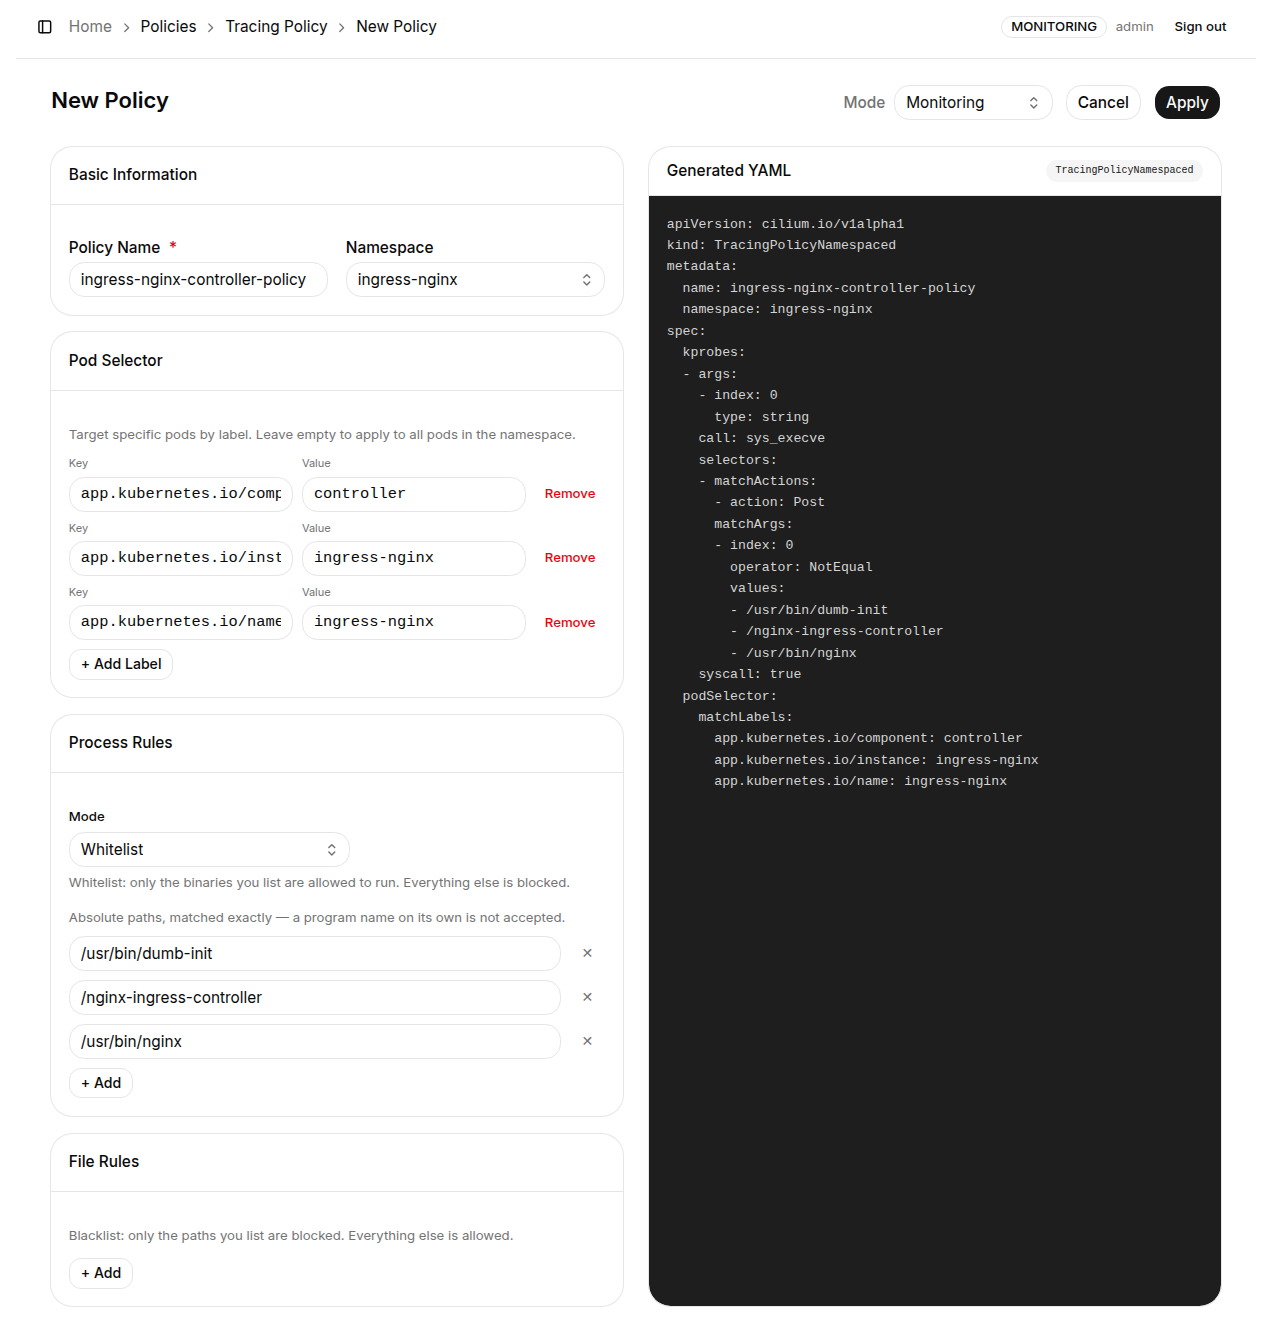
Steps:
- Find the target workload card in the grid
- Click the "Create Policy" button on the card
- K8s Sentinel generates a TracingPolicy draft and opens it in the form editor: the Policy Name and Namespace are pre-filled, the Pod Selector carries the workload's labels, and the Process Rules list every observed executable path in Whitelist mode
- Review and adjust the rules as needed, then click "Apply"
How it works: Based on all unique process execution paths recorded during the observation period, K8s Sentinel automatically generates Whitelist-mode Process Rules, allowing only those paths that were observed and deemed normal. Any program that did not appear during the observation period will be blocked once the Policy switches to Protect mode.
Let your workload run through a complete normal business cycle for 24 to 48 hours before creating Policies from Behavior Discovery results. A shorter observation period may miss some legitimate but infrequent programs (such as scheduled tasks or backup scripts), resulting in an incomplete Whitelist that blocks normal services when switching to Protect mode.